Exostiv Probe Client Overview
Exostiv Probe Client is the application used to connect to Exostiv Probe unit, run captures from the connected FPGA board and manage the collected data.
This client application is complementary to the Exostiv Core Inserter application used to generate and insert Exostiv IP cores.
Exostiv Probe Client uses the project files (extension .bpf) defined with the Exostiv Core Inserter application to retrieve the configuration of specific Exostiv IP cores and connect to them.
Using Exostiv Probe Client usually requires the following steps (click to jump to section):
- Start Exostiv Probe Client and load a project file (.bpf extension) relative to a specific Exostiv IP core insertion
- Verify the proper connection to a Exostiv Probe unit and then to the session that matches the project settings
- Run captures from the target board
- Visualize and manage the captured data
Start Exostiv Probe Client and load a project file
At Exostiv Probe Client startup, the welcome screen appears.
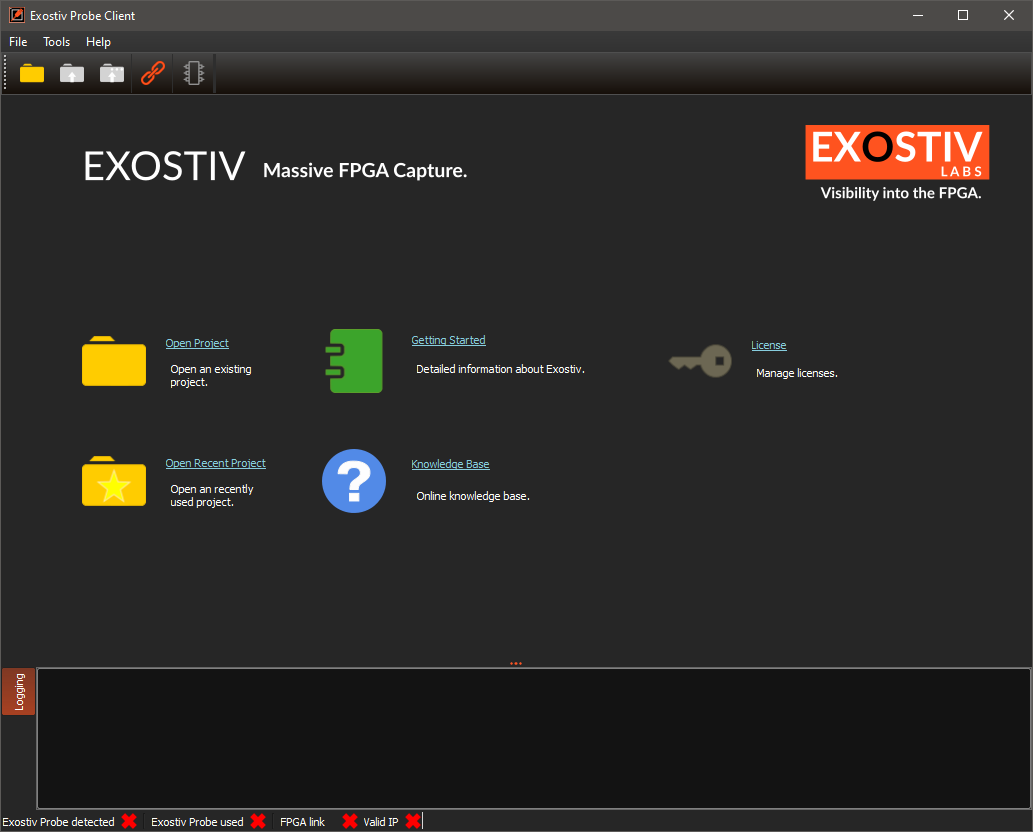
Exostiv Probe Client requires a user license, that is usually leased from an installed license server – please refer to this article to know how.
Click on ‘Open Project’ or use the menu ‘File > Open Project’ to open a project (extension .bpf).
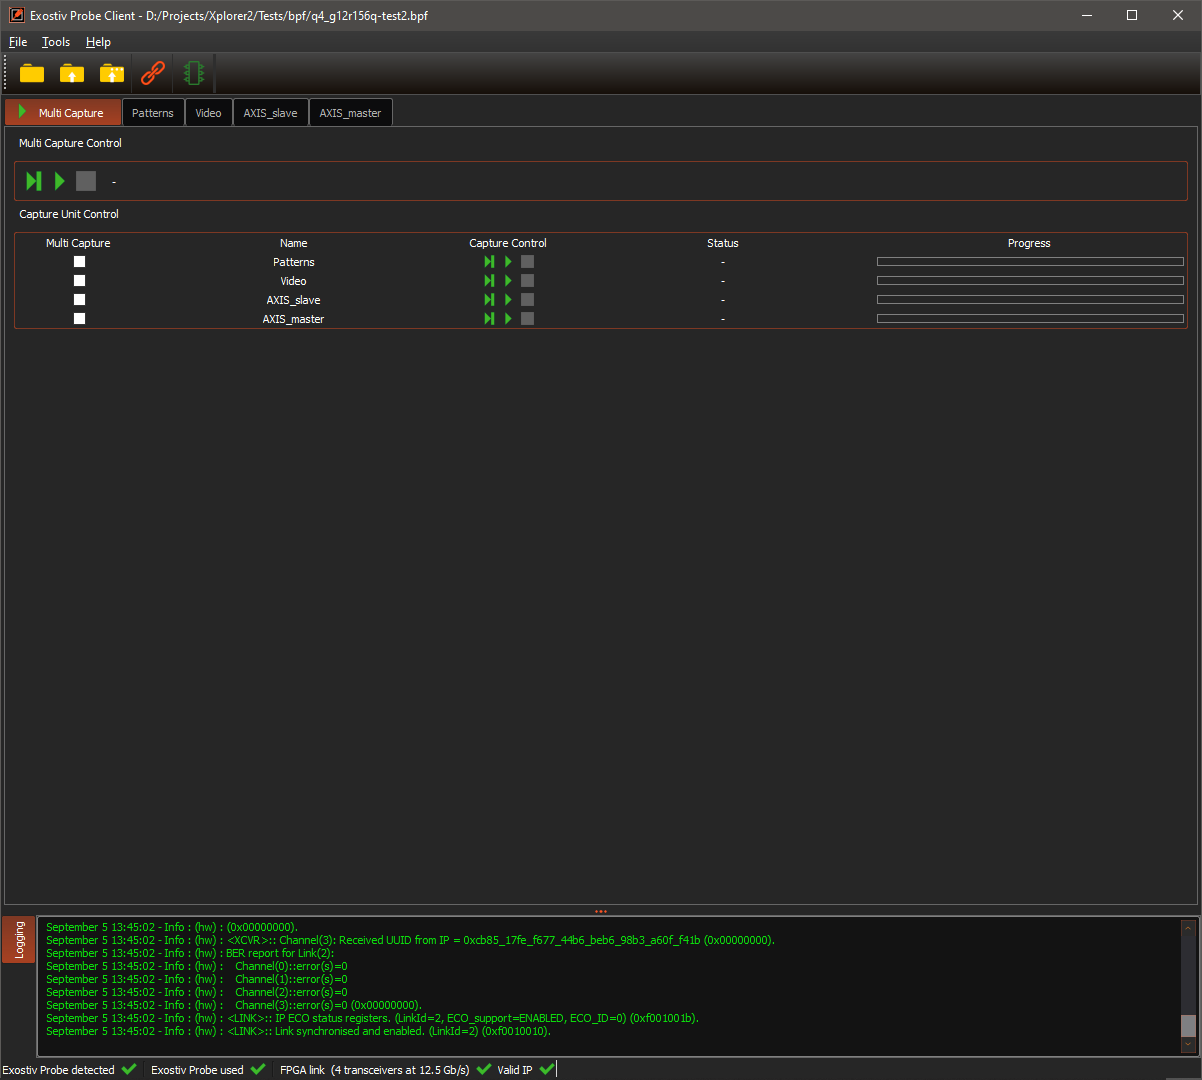
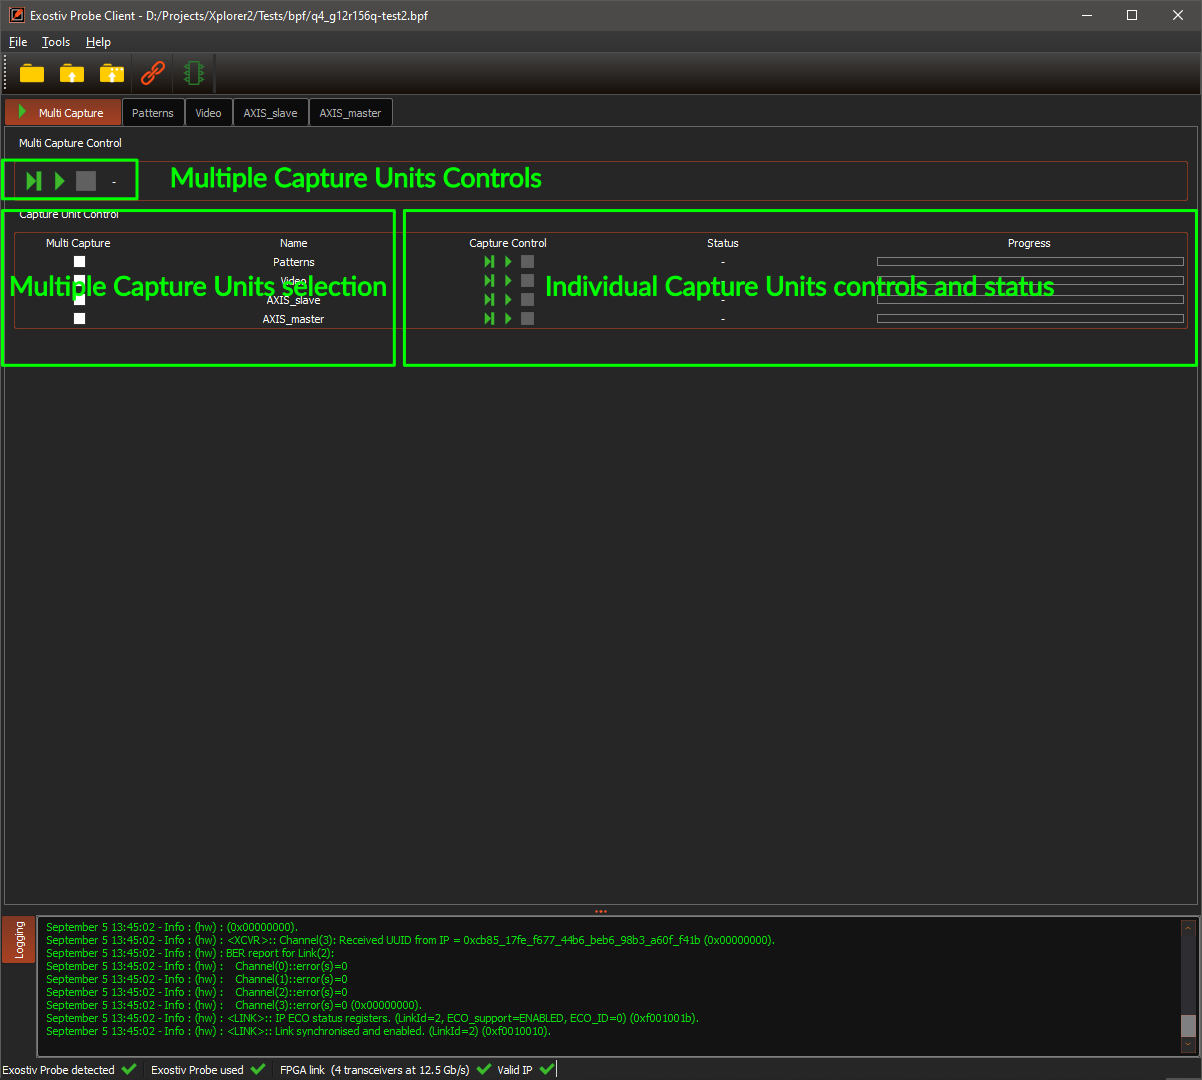
Once loaded, you land on the ‘Multi Capture tab’. This tab provides the controls for captures from multiple capture units.
Connect to a Exostiv Probe unit
The Exostiv Probe Client connection controls are accessible by clicking on the connect icon in the tool bar.
![]()
This opens the connection control window:
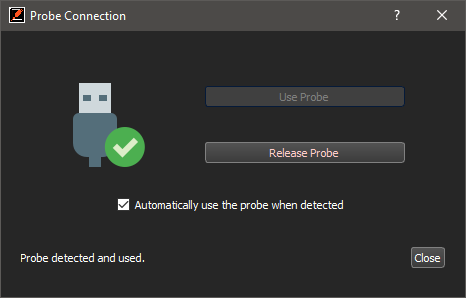
Clicking on ‘Use Probe’ and closing this window will start the connection procedure : to the probe and then to the target design IP.
If the target board is properly connected, the design running (make sure that – notably – the clock is running!) and the design contains the Exostiv IP instance that corresponds to the .bpf project settings, the negotiation succeeds and results in the statuses being updated (all green) at the bottom:

The Exostiv Probe Client is ready to run captures.
Run captures from the target board
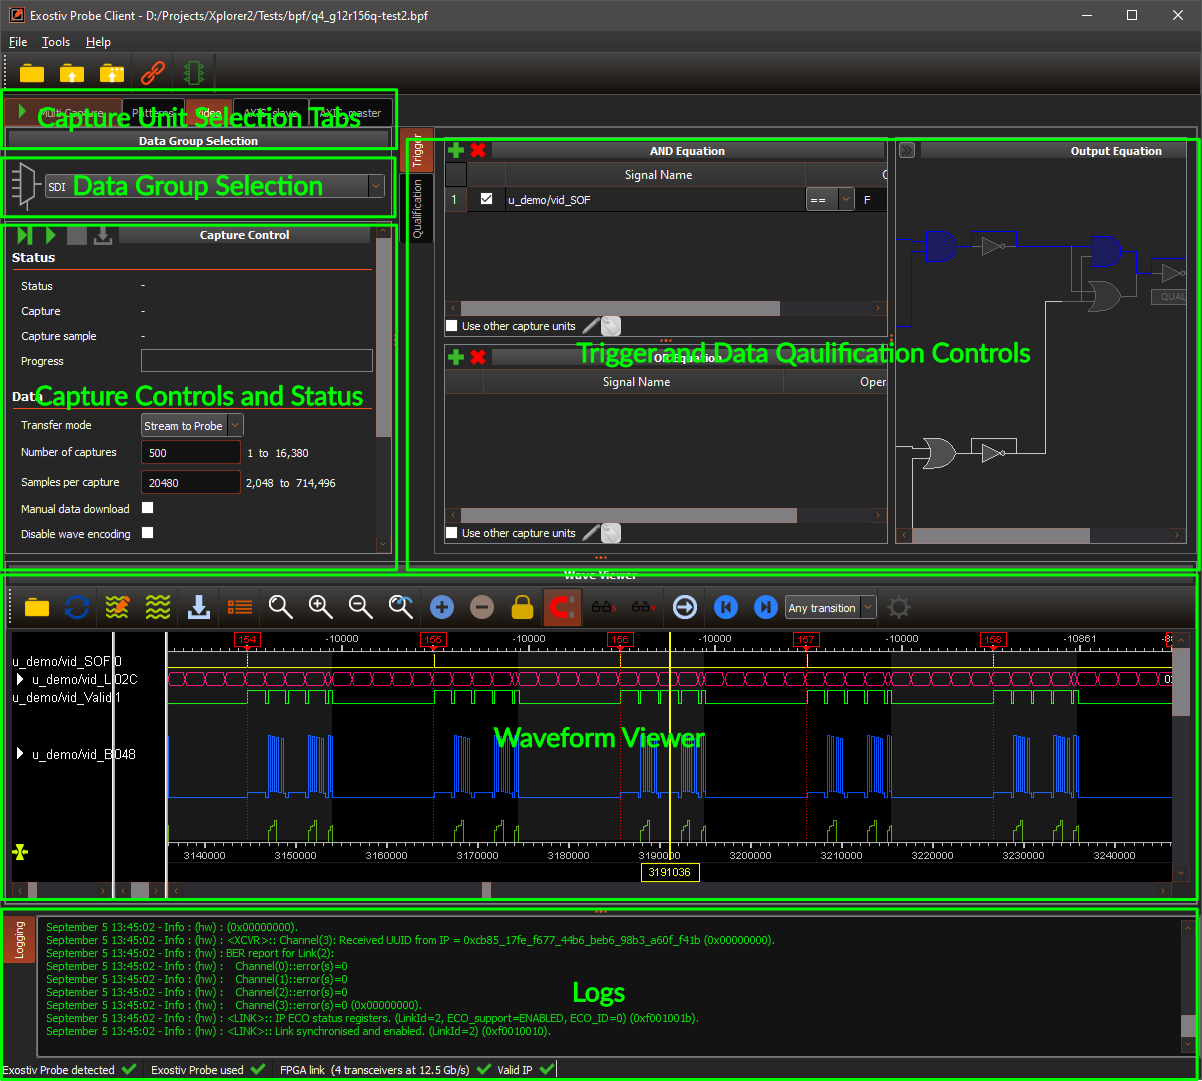
On top of the Exostiv Probe Client, tabs allow switching to each individual capture unit controls or select the ‘multiple cpature units tab’.
With individual tabs, captures are run from the selected capture unit only. The multi-CU tab allows running captures from multiple capture units at once.
(Click to enlarge the pictures)
Visualize and manage the captured data
By default, captured data are encoded and displayed in the waveform viewer window. Each capture unit currently has got its own waveform viewer window.
Exostiv Probe Client integrates Myriad V2 waveform viewer, capable of displaying and browsing extended waveform database sizes. The capture databases are stored onto the Exostiv Blade storage by default and accessed over the network by the client.
With Exostiv Probe Client and Exostiv Blade Client, the captured data is encoded stored into a subdirectory created at the same level as the project (.bpf), with the project name.
The data encoded as follows:
– <Project name>_cu#_dg#.sdf : when enabled, this is the waveform viewer encoded format. Such files potentially come with a .cfg file, that is information about the waveforms formatting.
– <Project name>_cu#_dg#.rawd : the captured raw samples in binary format. Please contact us if you’d like to decode and use this format.
cu# = ‘capture unit nr #’
dg# = ‘data group nr #’